
Previous article

The Graceful Crashes Mystery (feat. OpenSSL and PostgreSQL)

Celonis is the market leader in process mining. One key element to its success is "SaolaDB", an OLAP database optimized for process mining. This blogpost will give practical insights into tracking down bugs in large software projects based off the example of a recent incident. A component in the SaolaDB stack started crashing a few times a week - out of thousands of successful executions.
A closer inspection revealed that the problem was not a classical crash, like a segmentation fault. Instead, its mechanism for a normal shutdown was triggered. However, none of the other components seemed to initiate the shutdown. Tracking down the root cause was an exciting story of speculation, intuition and the right (and wrong) tools. Specifically, you will learn about the [AddressSanitizer], [GDB], [strace], and the LD_PRELOAD mechanism - and how one wild speculation turned out to be the right intuition to track down the root cause.

Setup
As part of our internal in-memory database SaolaDB, we have the following setup: There is a management component M, which is responsible for starting and orchestrating instances of component C. M communicates with C using stdin/stdout.
Logs
At some point, our monitoring reported the following for one instance of M and C:

So, component M reported that component C crashed (i.e., unexpectedly stopped operating from M's perspective); but with exit status 0, which normally does not mean any failure. (Expected failure exit statuses would be any non-zero value.)
Looking back in the log, we found another log message, so the related log messages essentially read like this:
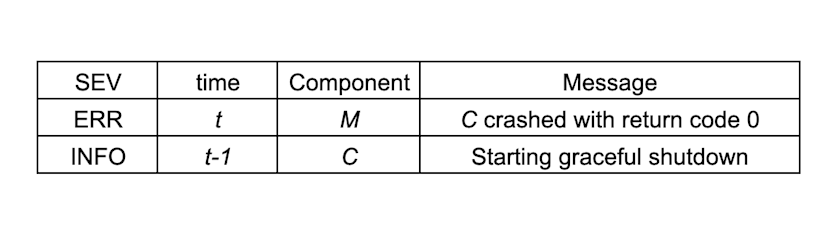
So, before component C exited with return code 0, it logged that it would start a graceful shutdown. This is in line with the return code 0, but then, why is component M reporting this as a crash?
Source of Shutdown
We started analyzing where the graceful shutdown originates from. The code essentially read like this:
    std::cin.read(&message, message_size);
if (std::cin.good()) {
  if (std::cin.eof()) {
    // Log error
  } else {
    // No logging here
  }
  //shutdown;
}
So, the shutdown was initiated because cin (C++ stream of stdin) was not good (). Furthermore, since no additional error was logged, we concluded that eof()(end of file, EOF) must be true. So, who would be responsible for the EOF on stdin?
EOF on stdin: Potential Reasons
Let's look at what would be potential reasons to get an EOF on stdin.
Did component M close the stream? This would explain the EOF we received. However, we could not find any code path that would support this hypothesis.
Some problem on OS-level with communication via stdin/stdout? Quite unlikely. Additionally, we realized that only a few instances had this problem repeatedly (as opposed to having completely random instances affected), which made this even less likely.
Is it some kind of memory corruption? The idea was that maybe, the stack gets corrupted in a way that causes the state of cin to be reported as seen (!good(), eof()). However, it is unlikely that a memory corruption would be that precise w.r.t. the affected memory area and never cause a real crash. We verified anyways with AddressSanitizer, but it did not find anything that looked relevant. It only reported two memory leaks, which we assumed to be library bugs:
    ==706734==ERROR: LeakSanitizer: detected memory leaks
Direct leak of 96 byte(s) in 1 object(s) allocated from:
      #0 0x7fxxxxxxxxxx in __interceptor_malloc ../../.././libsanitizer/asan/asan_malloc_linux.cpp:145
      #1 0x7fxxxxxxxxxx in CRYPTO_zalloc (libcrypto.so.3+0x2xxxxx)
Indirect leak of 13 byte(s) in 1 object(s) allocated from:
      #0 0x7fxxxxxxxxxx in __interceptor_malloc ../../.././libsanitizer/asan/asan_malloc_linux.cpp:145
      #1 0x7fxxxxxxxxxx in CRYPTO_strdup (libcrypto.so.3+0x2xxxxx)
SUMMARY: AddressSanitizer: 109 byte(s) leaked in 2 allocation(s).
More Information about EOF
Whenever an error occurs when executing a syscall, a thread-local variable errno is set to the corresponding error code. If this is a real end of file (or rather, end of stream) condition, the errno is not set. (read() then just returns 0 - instead of -1 which would indicate error). But we decided to verify this by reporting errno when cin reports the EOF.
We had to wait some time until this change was deployed. Once deployed, we got:
    EOF on stdin
Bad file descriptor
This was strange - why would the file descriptor of stdin be bad all of a sudden?
Helpful Observation
At this point, we made a helpful observation: affected instances all use a relatively uncommon feature F. There are a few things special about feature F:
Some file-handling code is used that is not used otherwise.
Only feature F requires C to connect to a PostgreSQL database.
Additional libraries are used as a consequence.
Given these facts, we need to come up with a hypothesis.
The Close(0) Hypothesis
Any library that does something related to IO (files, pipes, networking, etc.) might call close. The file descriptor of stdin is 0. What if there is an accidental call to close, where the fd argument comes from uninitialized memory and is therefore 0?
In order to verify the plausibility of this hypothesis, we wrote a small test program.
    int main(void) {
  auto another_thread = std::async([] {
    std::this_thread::sleep_for(std::chrono::seconds{1});
    close(0);
  });
  std::array buf;
  std::cin.read(buf.data(), buf.size());
  if (!std::cin.good()) {
    std::cout << "cin not good\n";
  }
  if(std::cin.eof()) {
    std::cout << "got eof" << std::endl;
  }
  perror("Reading from stdin");
}
The idea is to try reading from stdin, and while the read syscall waits for data, let a background thread close stdin. The output of this program looked like:
    % ./main

cin not good
got eof
Reading from stdin: Bad file descriptor
This is exactly the behavior we observed with the graceful crashes. It confirms the plausibility of the close(0) hypothesis. However, we need to prove now that there is really a call to close(0).
Changes to some file-handling code?
In a new version of some file-handling eviction code, close is called directly. Is this the path to explain the mystery? We checked, but we could not find any code path that would allow close to be called with fd 0. Furthermore, the git history invalidated the assumption: The changes were introduced after we saw the first occurrence of a graceful crash.
So, how can we find a possible call to close(0)?
GDB
One option would be GDB. We could set a breakpoint for close. This could even be a conditional breakpoint, so we would only stop once the file descriptor is really 0. Otherwise, we would stop for legitimate close calls to file descriptors, e.g., when closing an open file.
However, the GDB approach has a few issues:
Our binary is quite large, so GDB takes quite some time to load debug symbols. This would be bad for the start-up time of C.
The issue occurs very seldomly, so we cannot do it interactively.
A reliable scripting solution would be needed. However, this is quite hard to get right. And since we would need to run this on production instances, it would be quite risky.
Strace
Strace is a tool to trace syscalls. It can filter for specific syscalls. In recent versions, it gained the ability to even filter for file descriptors. Furthermore, Strace has a flag to print the backtrace for every reported syscall, so we would even know where the close(0) comes from. So, we modified the wrapper script to start component C under Strace supervision:
strace -o /data/strace.out -e close -e fd=0 -kf /path/to/executable
Running the binary under Strace supervision worked for one instance with an acceptable slowdown. However, it did not find any occurrence of a call to close(0). We assume that this is due to different timings due to Strace. In another instance, the slowdown was too large so we had to disable Strace quickly.
This was a quite bad situation because we did have our hypothesis, we knew it was plausible, but we neither could prove that it is correct nor could we find the origin.
LD_PRELOAD to the Rescue
The dynamic linker in Linux can be instructed to override functions in shared libraries by functions defined in another shared library. There are multiple ways to achieve this, but the probably most commonly known one is setting the LD_PRELOAD environment variable.
In our case, we override close. In our implementation of close, we check if the fd argument is 0. If yes, we print a backtrace on stderr. Otherwise, we call the real close from libc. We were lucky: relatively soon after deployment, we found a backtrace in the logs:
    libclose_override.so(my_backtrace+0xyy) [0x7fcxxxxxxxxx]
libclose_override.so(close+0xyy) [0x7fcxxxxxxxxx]
libcrypto.so.3(BIO_closesocket+0xy) [0x7fcxxxxxxxxx]
libcrypto.so.3(+0xyyyyy) [0x7fcxxxxxxxxx]
libcrypto.so.3(BIO_ctrl+0xyy) [0x7fcxxxxxxxxx]
libcrypto.so.3(BIO_int_ctrl+0xyy) [0x7fcxxxxxxxxx]
bin/component_C() [0x3xxxxxx]
bin/component_C() [0x3xxxxxx]
bin/component_C() [0x3xxxxxx]
bin/component_C() [0x3xxxxxx]
…
Analysis of the Backtrace
The two frames at the top are from our close-overriding library libclose\_override. The next 4 frames are from libcrypto, which is from the openssl project. The topmost frames that are attributed to component C are actually from libpq (PostgreSQL client library), which is statically compiled into component C. This we could identify with GDB, using the info line command (for example, info line *0x123456).
It took some time to understand what exactly needs to happen to end up with a call to close(0), but it was soon clear that the main problem was a race condition.
The Race Condition
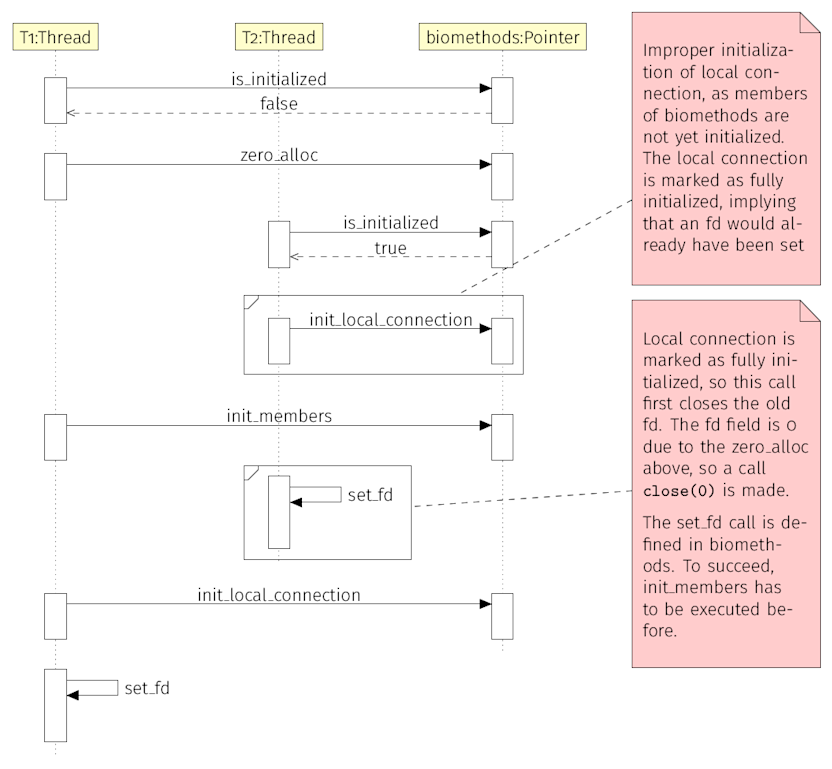
The Race Condition essentially consists of four blocks which need to be executed in the right sequence by two threads.
If a global pointer is zero (=non-initialized), a struct is zero-allocated and assigned to the global pointer. This is code in libpq. (is_initialized + zero_alloc in figures below)
The structure is initialized (by the thread that allocated it). The fields in this structure are function pointers. This is still code in libpq. (init_members)
A connection/thread specific structure T is initialized, with reference to the global pointer. If the function pointers above are not yet initialized (i.e., other thread executed block 1 but not block 2), T is marked as fully initialized. The initialization code is in libcrypto, but of course initiated from libpq. (init_local_connection)
A “set file descriptor” call for T is attempted. This requires that function pointers above are initialized, so the other thread now has to have executed block 2. However, if T is marked as already fully initialized, the “old” file-descriptor is closed. Since there was no file descriptor set before, the value of this field is still 0 at the point, causing a close(0) call. Again, this is code in libcrypto, but called by libpq. set_fd
Note that block 1 is in itself already racy as it might cause multiple allocations of the struct to be assigned to the global pointer. Additionally, note that if blocks 1 and 2 were one atomic block, the whole issue disappeared.

Solutions
There are two solutions to this problem:
Writing a patch. We wrote a patch and submitted it to the PostgreSQL project. In this patch, introduce a mutex to protect the initialization of the global pointer.
Don’t try to establish more than one PostgreSQL connection at the same time. We implemented this too because the change was more suitable to deploy as a hotfix.
Conclusion: Learnings
In order to track down such tricky problems, one needs the right tools, the right intuition and some luck. Sometimes, a tool that looks suitable turns out to be unsuitable.
For example, we did not expect Strace to be that slow, particularly since Strace also has flags to let it output timing information on syscalls. Considering the slowdown we experienced, we would probably not try to use Strace to time syscalls if we needed that.
Another important point is that wild guesses are welcome, but they should be verified for plausibility as soon as possible and discarded if they cannot be substantiated.
With the knowledge about the real reason for this problem, we can speculate whether we might also have found it if we continued with AddressSanitizer: One of the findings was a memory leak related to an allocation from libcrypto. This could be a version of the race condition where the structure for the global pointer would be allocated twice. But since the backtrace reported from ASan is unfortunately incomplete (probably due to lack of debug symbols for libcrypto), we don’t know this for sure.
Related Links

More blog posts on Celonis Engineering Blog
